|
|
|
|
|
|
Lower Demand to the RESCUE
|
|
DR. M.S. KAPADIA
, |
Monday, August 22, 2011, 11:49 Hrs [IST] |
|
|
|
 The power sector has
done better than
expected, in terms of the
national demand-supply
position. While increased
generation did help the
situation, it is the lowerthan-
expected increase in
power demand that came
to the rescue, notes
Dr. M.S. Kapadia. The power sector seems to have fared better during the
first quarter, compared to what Central Electricity
Authority had projected in its Load Generation Balance
Report (LGBR) for the current year. The improvement was
due mainly to lower than expected increase in power demand.
Power generation was up by 8.3 per cent during the quarter.
Power availability was assessed better at 213 billion kwh,
against 203 billion kwh factored in LGBR, while requirement
of around 228 billion kwh fell short of 235 billion kwh, which
culminated in a lower average deficit of around 6.6 per cent
over the quarter, as compared to 14 per cent expected in LGBR.
Likewise, peak power deficit was also lower at 9.2 per cent,
compared to 15.7 per cent feared in LGBR.
The gross energy generation in the country has been assessed
at 855 billion kwh for 2011-12 in LGBR, which has factored for
this purpose power availability from various stations in
operation including CPP and non-conventional energy, fuel
availability, proposed maintenance schedule of the units,
anticipated water availability at hydro electric stations, as also
a capacity addition of 17,191 mw over the year, comprising
14,111 mw of thermal, 2080 mw of hydro and 1,000 mw of
nuclear power. The first quarter has seen 3,509 mw of new
capacity, one-fifth of the targeted addition over the year,
comprising 2,970 mw of thermal and 539 mw of hydropower.
 The country was to tackle average deficit of 10.3 per cent
and a peak demand/availability deficit of around 12.9 per cent over the year, with 25 states likely to face normal
deficit and 9 others surplus. Power requirement was
expected to go up by around 8.4 per cent over the year and
total ex-bus energy availability (i.e. energy dispatched by
the generating station after internal consumption) by 6.2
per cent, which would imply a rather sharp worsening from
8.5 per cent average deficit and 9.8 per cent peak
demand/availability deficit in 2010-11. The most
consuming and producing Western region was assessed to
face an average deficit of 11 per cent, northern region 10.9
per cent and southern region 10.5 per cent, whereas eastern
region that requires 11 per cent of the energy would undergo
a milder deficit of 7.7 per cent and north-eastern region a
nominal deficit.
PROJECTION VS ACTUAL PERFORMANCE IN 2011-12 (Q1) |
|
Energy (MU) |
Peak Power (MW) |
|
Projection |
Actual |
Projection |
Actual |
|
Reqmt |
Supply* |
Reqmt |
Supply* |
Demand |
Supply** |
Demand |
Supply** |
| Northern |
70,420 |
63,078 |
66,976 |
63,932 |
116,800 |
99,890 |
37,651 |
34,575 |
| Western |
74,095 |
62,925 |
72,421 |
65,111 |
121,990 |
102,716 |
39,566 |
33,705 |
| Southern |
61,842 |
51,639 |
61,843 |
59,478 |
100,492 |
83,021 |
33,937 |
31,489 |
| Eastern |
26,192 |
23,106 |
23,787 |
22,752 |
45,755 |
38,428 |
14,000 |
12,879 |
| North-Eastern |
2,488 |
2,409 |
2,631 |
2,351 |
5,793 |
5,270 |
1,762 |
1,581 |
| All India |
235,035 |
203,157 |
227,658 |
212,628 |
390,825 |
329,323 |
122,391 |
111,163 |
| *Indicates actual availability **Indicates peak demand met; Source: CEA |
The country enjoyed much better power position during
the first quarter for which the data are available, compared
to the projection for the quarter. Average deficit for the
nation worked out to 6.6 per cent, less than a half of the
severity feared over the quarter. The actual provisional
peaking demand/supply shortage was 9.2 per cent, against
14 per cent feared during the quarter. While the western
region suffered 10 per cent deficit, against 15 per cent
feared over the first quarter, northern region had to bear
with only 4.5 per cent shortfall, half of the deficiency
projected for the quarter.
STATE-WISE DETAILS
Maharashtra, the largest consuming state, was to face 18.9
per cent deficit, escalating from 16.6 per cent in 2010-11 and
18.7 per cent in 2009-10. The state's power requirement was
projected to go down 3 per cent, whereas the availability
was feared to deteriorate by a steeper 6 per cent. The power
crunch in the state was expected to ease from around 23 per
cent in H1 to 14 per cent in H2. In the meantime, the state
suffered 15 per cent average deficit, less than 24 per cent
projected for the quarter, due to slower pace in power
requirement, relative to power availability.
 Uttar Pradesh was projected to face a much worse 24 per
cent deficit, compared to 15 per cent in 2010-11, due to a
much faster increase in power requirement and a little
lower power availability. The deficit was expected to be
uniformly high across the months. However, the state faced
9 per cent deficit in Q1, about a third of that feared, due to better power availability on the one hand and a lower usage
on thther. The deficit in Tamil Nadu was expected to
worsen three times to 18 per cent due to 9 per cent increase
in requirement, against a decline in availability. The state
was to face double-digit shortfall throughout the year
(barring 7 per cent in July), though during the first quarter
it had to bear only 5 per cent shortfall, a fifth of that
projected for the period. Andhra Pradesh was projected to
face 12 per cent deficit, four
times the level in 2010-11 as its
power needs were expected to
mount 12 per cent, while the
availability was to rise only
around 2 per cent. The state
suffered 3 per cent average
deficit, a fourth of the severity
expected over the quarter.
Gujarat would encounter only 2
per cent shortfall, improving
from 5.7 per cent in 2010-11
following a double-digit
improvement in power
infrastructure. The state
suffered only nominal shortfall
during the first quarter, while it
was expected to be power
surplus during July-September.
Karnataka was to be powersur plus
due to 19 per cent
improvement in power availability. Barring Q1 during
which it suffered 5 per cent shortfall and the busy March,
the state was assessed to have more power than it needed.
Power Deficit Projection: 2011-12 |
|
Average |
Peak |
|
Proj. |
Actual |
Proj. |
Actual |
| Apr-11 |
17.5 |
8.0 |
17.6 |
10.4 |
| May-11 |
11.9 |
6.5 |
16.0 |
8.9 |
| Jun-11 |
11.2 |
5.3 |
13.6 |
9.2 |
| Jul-11 |
6.3 |
|
9.2 |
|
| Aug-11 |
5.6 |
|
8.7 |
|
| Sep-11 |
5.5 |
|
7.8 |
|
| Oct-11 |
10.1 |
|
9.2 |
|
| Nov-11 |
8.4 |
|
6.7 |
|
| Dec-11 |
11.5 |
|
9.2 |
|
| Jan-12 |
10.6 |
|
10.2 |
|
| Feb-12 |
10.6 |
|
11.0 |
|
| Mar-12 |
14.0 |
|
12.9 |
|
| Annual |
10.3 |
|
12.9 |
|
| Source: CEA |
MONTH-WISE DETAILS
The average power deficit for the country was to fall from
17 per cent in April to 11-12 per cent in May-June and 5-6
per cent during the monsoon months July-September, but escalate to 11 per cent per month during the second half of
the year; with a high of 14 per cent feared in March. Actual
deficit was much lower at 8 per cent in April, 6.5 per cent in
May and 5.3 per cent in June. As stated earlier, the lower
average deficit was due to 3 per cent fall in power demand,
coupled with around 4 per cent better power availability.
 The hydro rich states like Himachal Pradesh, Jammu &
Kashmir, and Uttarakhand that have run-of-river schemes
on the Himalayan rivers are expected to be energy surplus
during monsoon period, while they would face severe
shortage conditions during the winter when the generation
from hydro schemes dwindles to the minimum. The
constituent states/UT of Delhi, Himachal
Pradesh, Dadra & Nagar Haveli and Sikkim
shall have both peaking and energy surplus
on annual basis. Chhattisgarh, Karnataka,
Puducherry, Mizoram and Tripura would be
surplus in terms of energy whereas Orissa
would be in comfortable position in terms of
peak on annual basis.
METHODOLOGYThe exercise for anticipated power supply
position in the country involves (a)
assessment of power requirements in each
State (month-wise) in terms of unrestricted
energy requirement and peak demand and
(b) realistic estimate of electricity
availability both in terms of energy and capacity from
various sources. While the peak demand and energy
requirement in the States are worked out on the basis of the
trend analysis considering the actual data for the preceding
years as also the specific load requirements, if any, as per
established methodology. The energy availability was
worked out on the basis of generation targets set by the
Operations Performance Monitoring Division, CEA after
detailed consultations with the generating companies/SEBs
and approved by Ministry of Power. The Regional Power
Committees prepare the estimates of month-wise power
requirement and availability for each of its constituents and
finalize the same in consultation with them.
The region wise power supply position was
coordinated in Grid Management Division,
CEA to arrive at the all India power supply
position.
The energy availability in each State is
worked out at respective Regional Power
Committee Secretariat as under: - Generation from generating plants owned
by the state
- Share of power from the common projects
- Allocation of firm power from Central
generating stations
- Allocation from unallocated quota of
power from Central generating stations as
per the allocation in vogue
- Energy import-export under long term bilateral
agreements
The LGBR projections have tended to be relatively close
to actual performance. Thus, actual power availability in
FY11 was less than one per cent above the projection, while
it fell 2 per cent short of projection in FY10. Actual power
requirement fell 1-2 per cent short of projection in these
two years.
 PROGRESS IN XI PLAN PROGRESS IN XI PLAN
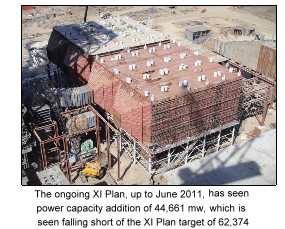
The ongoing XI Plan has seen addition of 44,661 mw by
June 2011 inclusive of 10,694 mw from new and
renewable energy sources. The feat though already 64 per
cent higher than the 10th plan and more than twice to the
accomplishment in the IX Plan would still be terribly
short of 62,374 mw capacity addition targeted for the
plan that is going to end in March next. As at the end of
June, the country had 176,990 mw of installed capacity,
comprising 115650 mw of thermal, 38,106 mw of hydro,
4,780 mw of nuclear and 18,454 mw of renewable sources.
In addition, there was also 19,509 mw of grid-connected
captive power capacity.
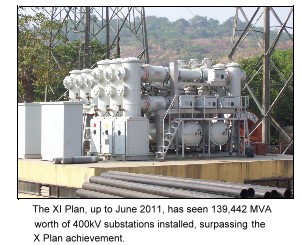
The capacity addition of 109,436 ckm to 400kV
transmission lines and 135,969 ckm to 220kV transmission
lines till June in the ongoing XI Plan has already exceeded
their respective additions during the 10th Plan. Likewise the
additions of 139,442 MVA in 400kV substations 208,661
MVA in 220kV substations have also surpassed their X Plan
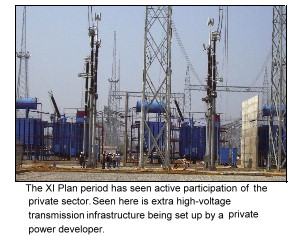
augmentations. Moreover, during the ongoing plan, private
sector/joint ventures have marked their presence in this
field that was exclusively in the public sector earlier.
Region-wise Energy Scenario: 2011-12 |
|
Energy Availability (MU) |
Peak Power (MW) |
|
Reqmt |
Supply |
Reqmt |
Supply |
| Northern |
279,581 |
249,145 |
41,000 |
36,140 |
| Western |
287,757 |
256,237 |
42,422 |
37,781 |
| Southern |
250,024 |
223,814 |
37,247 |
31,859 |
| Eastern |
105,461 |
97,294 |
17,171 |
15,185 |
| North-Eastern |
10,918 |
10,884 |
2,198 |
2,068 |
| All India |
933,741 |
837,374 |
136,193 |
118,676 |
| Source: CEA |
|
|
|
|
|
|
|
|
|
Loading... |
 |
|
|
|