The XI Plan period that concluded on March
31, 2012, was an eventful episode for the
power sector. Although the cherished "Power
for All" dream remained elusive, there were
significant achievements on various counts,
including key policy reforms and initiatives.
As we move into the XII Plan with renewed
vigour,
M.S. Kapadia takes a close look at
the power sector scorecard in the bygone
Plan period.
In a major landmark, the generating capacity in the
country crossed 2 lakh mw mark, scaling to 200,287 mw,
in early April with the commissioning of a 660 mw unit
of the Jhajjar thermal power plant in Haryana. The
installed capacity then comprised 1,32,013 mw in
thermal, 38,991 mw in hydro, 4,780 mw in nuclear, and
24,503 mw in renewable energy sources (RES). The total
installed capacity, at the end of the XI Plan (March 31, 2012),
was 199,627 mw.
The country's power capacity had crossed 1 lakh mw in
2001-02. Earlier, power infrastructure had grown from 1,362
mw on the eve of independence to 28,448 mw by 1980 and to
63,636 mw by 1990. Despite the repeated failure in meeting
targets, it is noteworthy that the second 1 lakh mw addition
in power sector infrastructure was achieved in just a decade,
as compared to 50 years for the first 1 lakh mw.
Deficiency in power infrastructure has arisen due to
ballooning power needs of an accelerating economy that
broke through the 3-5 per cent growth plateau till 1990 and
5-6 per cent in the next decade to enter a higher 5-7 per cent
growth trajectory in the new millennium. Despite the
rapid power infrastructure growth, policy makers cannot
be complacent as, notwithstanding the increase in capita
consumption of electricity from 15.6 units in 1950 to 766,
units during the year 2009-10, the power shortage has
remained a major stumbling block to a rapidity in
economic and social development of masses in the country.
The per capita electricity consumption in the country is
just around a fourth of the level in China and less than a
tenth of that in USA.
Untitled Document
GROWTH IN INSTALLED POWER CAPACITY (MW) |
|
Thermal |
Nuclear |
Hydro |
RES |
Total |
|
Coal |
Gas |
Diesel |
Total |
|
|
|
|
| 8th Plan |
12,917 |
4,219 |
129 |
17,265 |
660 |
3,350 |
884 |
22,159 |
| 9th Plan |
7,976 |
4,601 |
841 |
13,419 |
495 |
4,611 |
726 |
19,251 |
| 10th Plan |
8,991 |
2,529 |
67 |
11,586 |
1,180 |
8,385 |
6,132 |
27,283 |
| 11th Plan (Prov) |
40,901 |
4,439 |
-2 |
45,338 |
880 |
4,337 |
16,743 |
67,298 |
GROWTH BY MODE
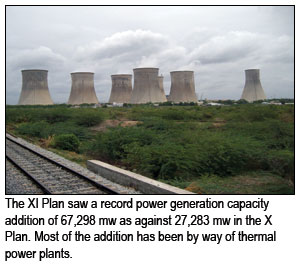
The XI Plan that ended on 31 March 2012, has witnessed an
unprecedented growth in capacity with addition of 67,298
mw of fresh capacity over the plan showing record 1.5-fold
increase over 24,283 mw added during the X Plan period.
During the IX Plan the capacity addition stood at 19,251 mw.
The last year 2011-12 of the XI plan in fact saw new
benchmarks created in the capacity addition. A record
capacity of 26,001 mw, almost equal to what was added in X
Five Year Plan got added during the year.
Thermal power continued to dominate capacity
augmentation in the XI Plan, accounting for two-thirds of
new capacity. As was the case during the X Plan period, over
80 per cent of incremental thermal capacity was coal-fired.
With heavy dependence on coal likely to continue for quite
some years in future, there is evidently great concern over
domestic availability and pricing of this crucial fuel in thermal
generation. Gas is the next preferred fuel with new capacity
based on this feedstock amounting to 4,439 mw in the XI Plan.
The thermal capacity addition based on gas feedstock was
lower at 2,529 mw during the X Plan, against average of 4,400
mw in the earlier two Plan periods. Diesel-based thermal
capacity appears to be on the way out due to environment and cost considerations. The share of diesel-based thermal to total
thermal declined from 1.5 per cent in the IX Plan to less than
one per cent by the end of the XI Plan.
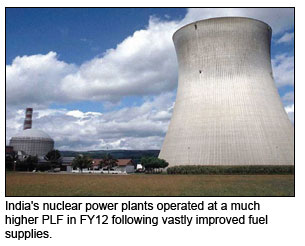
Nuclear power saw addition of around 880 mw during the
XI plan, less than 1180 mw commissioned in the X Plan.
However, nuclear generation, particularly PLF shot up in the
later years of the plan due to signing of civil nuclear treaty
with US and the consequent dramatic improvement in fuel
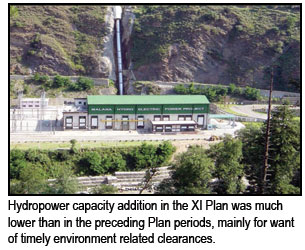
supplies from global suppliers. Around 4,300 mw got
commissioned in hydropower (renewable) during the XI Plan,
substantially less than 8,300 mw in the X plan and also lower
than 4,600 mw in the IX Plan. Environment concerns, forest
clearances and land issues held back the new capacity addition
in the hydropower.
Untitled Document
GROWTH IN POWER GENERATION |
|
y-o-y % |
|
y-o-y % |
| 2000-01 |
4.0 |
2006-07 |
7.2 |
| 2001-02 |
3.1 |
2007-08 |
6.4 |
| 2002-03 |
3.2 |
2008-09 |
2.8 |
| 2003-04 |
5.1 |
2009-10 |
6.1 |
| 2004-05 |
5.2 |
2010-11 |
5.5 |
| 2005-06 |
5.2 |
2011-12 |
8.1 |
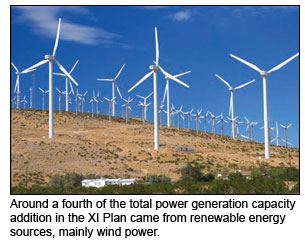
The star performer in the XI Plan was grid-connected
renewable energy sources that fall under the Ministry of
New & Renewable Energy (MNRE). Capacity addition
under renewable energy sources comprising small hydro,
solar energy, wind energy, biomass gasifier, biomass
power, urban and industrial waste power, etc scaled a
record 16,743 mw, around a fourth of the total capacity
addition in the XI Plan and more than twice that
commissioned during the X Plan. The feat raised their
share in grid connected generation to around 12 per cent,
from 6 per cent at the end of the X Plan and just around 1.5
per cent at the end of the IX Plan. According to MNRE
sources, 10259.60 mw wind power, 1418.85 mw small
hydropower, 1,996 mw biomass power, 46.20 mw wasteto-
power and 940 mw solar power was commissioned over
the Plan period.
CAPACITY BY REGION
The western region accounted for 32 per cent of installed
capacity in the country at the end of 2011-12, followed by 26-
27 per cent each in northern region and southern regions.
Eastern and north-eastern regions together formed just
around 14 per cent. Whereas western region dominates in
thermal capacity, northern and southern region are
prominent in hydro power. Southern region leads in
renewable energy sources (RES) with 47 per cent share,
followed by western region with 32 per cent and northern
region with 18 per cent.
Untitled Document
POWER GENERATION: 2011-12 |
(billion kwh) |
| |
Program |
Actual |
% of |
y-o-y |
| |
|
|
Program |
% chg |
| Thermal |
712.23 |
708.45 |
99.47 |
6.5 |
| Nuclear |
25.13 |
32.27 |
128.41 |
22.9 |
| Hydro |
112.05 |
130.43 |
116.40 |
14.2 |
| Bhutan Import |
5.59 |
5.28 |
94.60 |
-5.8 |
| Total |
855.00 |
876.43 |
102.51 |
8.1 |
CAPACITY BY OWNERSHIP
Power is the major sector, after telecom, where private sector
has responded positively to reforms, committing huge funds
in generation, transmission and distribution projects. As at
the end of FY12, the share of private sector in installed
capacity worked out to 27 per cent, against 30 per cent by
Central government and 43 per cent by state governments
who have the longest presence in the sector. Private sector
accounts for 23 per cent of thermal capacity, 6 per cent of
hydro capacity and as much as 86 per cent of grid-connected
RES. nuclear capacity of 4,780 mw is exclusively in the
Central sector. Central PSUs like NTPC, NHPC, SVJNL, etc
own 35 per cent of thermal capacity and 23 per cent of
hydropower capacity, while PGCIL owns the national
transmission grid. State-level utilities account for 42 per cent
of thermal capacity, 70 per cent of hydro and 14 per cent of
RES in the country. During 2011-12, private sector dominated
capacity addition in public utilities with 11,445 mw out of a
total of 19,690 mw commissioned during the year.
 XII PLAN PROJECTIONS
The Working Group on Power for the XII Plan has proposed to
add 75,785 mw of new power generation capacity in public utilities over the Plan period under "base case" that is explained
as "business-as-usual scenario particularly in respect to
domestic coal availability." GDP growth has been estimated at
9 per cent and electricity elasticity to GDP at around 0.9 for
this projection. Against the requirement of 653 million tonnes
of coal (net of captive mines,SCCL, etc), CIL has committed
to supply 415 million tonnes which is about 75 per cent of its
production of 556 million tonnes in BAU scenario. CIL is to be
impressed upon for formulating exigency plan to enhance
production to meet the requirement of the power stations,
the working group has stressed. In addition, grid interactive
renewable capacity addition of about 18,500 mw has been
proposed comprising of 11,000 mw wind, 1,600 mw small
hydro (each project of up to 25 mw), 2,100 mw biomass
power, bagasse cogeneration and waste-to-energy put
together and 3,800 mw solar has been considered based on
inputs provided by MNRE. The estimated fund requirement
during XII Plan for generation, including renewable, works
out to about Rs.638,600 crore including Rs.2,72,582 crore for
advance action for XIII Plan projects. Private sector share in
capacity addition in public utilities is projected at around 55
per cent for the XII Plan, against 36 per cent likely in the XI
plan. Private sector would probably continue to account for
lion's share in RES capacity addition over the XII Plan.
Untitled Document
STATES WITH CHRONIC POWER DEFICIT |
(per cent) |
|
MAH |
MP |
KAR |
TN |
UP |
BIH |
| 2007-08 |
-18.3 |
-14.1 |
-2.7 |
-2.8 |
-17.5 |
-14.2 |
| 2008-09 |
-21.4 |
-17.2 |
-6.0 |
-7.9 |
-20.9 |
-17.6 |
| 2009-10 |
-18.7 |
-19.0 |
-7.7 |
-6.2 |
-21.7 |
-15.5 |
| 2010-11 |
-16.6 |
-20.2 |
-7.6 |
-6.5 |
-15.0 |
-14.0 |
| 2011-12 |
-16.7 |
-16.9 |
-11.2 |
-10.5 |
-11.4 |
-22.0 |
According to the report of Working Group on Power,
availability of coal indicated by CIL would support only 7,500
mw of CIL-linked new power generation capacity as against
38,000 mw required to meet the power ministry's proposed
target of 76,000 mw during the current (XII) Plan period.
GENERATION
Electricity generation was up by a record high 8.1 per cent
during 2011-12, according to tentative data from CEA, as
compared to 5.5 per cent in 2010-11, 6.1 per cent in 2009-10
and 2.8 per cent in 2008-09. However, behind the robust show
during the FY12, the feat of the generation over the year raises
some concerns. Thus, the average monthly generation
quickened from 8.2 per cent in Q1 to around 10 per cent in
next two quarters, but dropped to 4.6 per cent in Q4, with the
last month of the fiscal recording just around 2.1 per cent.
The electricity generation during FY12 was 876.43 billion
kwh (BU), exceeding target of 855 BU for the financial year.
Power import from Bhutan JV was assessed at 5.28 BU (FY11:
5.61 BU). In view of improved generation by coal-based,
nuclear and hydropower stations, the requirement for costly
power from gas, liquid fuel and DG sets was reduced.
Improvement in generation has followed growth in installed
power capacity. The stock of installed capacity went up by 12
per cent during 2011-12, against 7.4 per cent in 2010-11, 6.8
per cent in 2009-10 and 2.1 per cent in 2008-09.
Thermal generation was up by 6.5 per cent during FY12,
vastly bettering 3.8 per cent during 2010-11, but fell short of
8.5 per cent increase two years back. PLF at thermal projects
worked out to 73.29 per cent, against 74.97 per cent in 2010-
11. PLF at coal fired thermal was 73.46 per cent (FY11: 75.25
per cent), whereas it was assessed at 70.89 per cent (73.82 per
cent) at lignite based thermal and around 60 per cent (66 per
cent) in gas/diesel based thermal plants. Many of the newly
commissioned units could have generated more power, but
they could not do so on account of various problems which
included coal shortages, transmission constraints etc. During
the year, the anticipated gap between the requirement and
availability of domestic coal was estimated around 54 million
tonnes. Out of this, 35 million tonnes was to be met through
import, for which all the utilities had been advised to take
necessary action and remaining 20 million tonnes was the
requirements of power plants designed on imported coal.
Generation from nuclear power plants increased by 23 per
cent, slower than 41 per cent in FY11 and 27 per cent in FY10.
Following vastly improved fuel supplies on the country
signing civil nuclear treaties, PLF at the nuclear power stations shot up from 41 per cent in 2008-09 to 77 per cent by 2011-12.
Hydropower generation increased by 14 per cent during the
year, against 10 per cent increase in FY11, and 6 per cent
decline during FY10. The improvement reflected effects of
better southwest monsoon.
DEFICIT
With overall energy availability placed at 857 billion kwh
(BU), against the requirement of 937 BU, the average deficit
was assessed at 8.5 per cent during 2011-12. The measure of
shortage remained at the level in the preceding year, though it
was less than 10-11 per cent during the first three years of the
XI Plan. The deficit turned out to be lower than 10.3 per cent
projected in CEA's Load Generation Balance Report for the
year. While demand was a little more at 937 BU, against 934
BU expected for the year, the power availability turned out to
be much better at 857 BU, against 837 BU estimated for the
year. The deficit had eased from around 7.6 per cent in April to
4.8 per cent in August, but then worsened to the fiscal's peak
level of 11.3 per cent by December, with the average deficit
placed at a little less than 10 per cent during the last quarter of
the fiscal.
Untitled Document
POWER SUPPLY POSITION |
| |
Peak Power (MW) |
Energy (million kwh) |
| |
Demand |
Met |
Deficit |
Deficit (%) |
Reqmt |
Avble |
Deficit |
Deficit (%) |
| 2006-07 |
100,715 |
86,818 |
-13,897 |
-13.8 |
690,587 |
624,495 |
-66,092 |
-9.6 |
| XI Plan |
| 2007-08 |
108,866 |
90,793 |
-18,073 |
-16.6 |
739,343 |
666,007 |
-73,336 |
-9.9 |
| 2008-09 |
109,809 |
96,785 |
-13,024 |
-11.9 |
777,039 |
691,038 |
-86,001 |
-11.1 |
| 2009-10 |
119,166 |
104,009 |
-15,157 |
-12.7 |
830,594 |
746,644 |
-83,950 |
-10.1 |
| 2010-11 |
125,077 |
112,167 |
-12,910 |
-10.3 |
862,125 |
789,013 |
-73,112 |
-8.5 |
| 2011-12 |
130,006 |
116,191 |
-13,815 |
-10.6 |
936,568 |
857,239 |
-79,329 |
-8.5 |
Maharashtra, the largest power consumer state in the
country faced 16.7 per cent deficit during the year. Bihar (22
per cent), Madhya Pradesh (16.9 per cent), Uttar Pradesh,
Tamil Nadu and Karnataka (11 per cent each) were the other
major states with significant shortage, whereas Gujarat was
nearly self-sufficient in power needs.
By the way, there are some states that have faced power
shortage consistently. Below are some major states where
power deficit broadly worsened over the XI Plan. These six
states together accounted for 46 per cent of the power
requirement during the 2011-12. Gujarat was among the
fewer states which could bring down deficit. The power
shortage in the state declined from 16.2 per cent in 2007-08 to
only 0.4 per cent by the end of the plan. Even as the state's
power needs grew from 69 BU to 75 BU between 2007-08 and
2011-12, its availability improved from 58 BU to 74 BU.
TRANSMISSION & DISTRIBUTION
One of the most striking developments during the XI plan was
the entry of private sector in the T&D segment that has generally been a public sector bastion. The private sector/JV
owned at the end of the plan 8,443 circuit km (ckm) of 400kV
lines and 468 ckm of 220kV lines.
Overall, 400kV transmission lines grew 55 per cent during
the XI plan to cross 1 lakh ckm and reach 1.18 lakh ckm. In
fact, the transmission line length more than doubled since the
turn of the new millennium. The country's 220kV network
increased by 22 per cent to 140,295 ckm during the Plan
period. As of March 31, 2012, there were 148,682 substations
of the 400kV type and 221,283 of the 200kV variety.
 XII Plan projections:
 Over the decades, a robust interstate
and inter-regional transmission system has evolved in
the country which facilitates widespread reach of power over
the vast area of the country. In 1947 the maximum voltage
level of transmission line was 132kV that was subsequently
increased to 220kV in 1960 and 400kV in 1977. To reduce right
of way requirement for transmission lines and overcome
constraints in availability of land for substations, 765kV
transmission voltage is being increasingly adopted and gasinsulated
substations are being provided wherever availability
of land is a problem. HVDC 500kV back-to-back was
introduced in the year 2000. Recognizing the need for the
National Grid, thrust was given to enhancement of the
interregional capacity in a phased manner.
Considering about 76,000 mw capacity addition, an
interregional transmission capacity (IRTC) of 37,800 mw has
been planned for the XII Plan. Thus, IRTC at the end of XII
Plan is expected to be of the order of 63,000 mw. Transmission
line additions of about 1,00,000 ckm, HVDC terminal
capacity of 13,000 mw and AC transformation capacity of
2,70,000 MVA has been planned for the XII Plan.
765kV System: During XI Plan, a number of 765kV lines
and substations have been added and a few more are under
construction. A number of new 765kV lines and substations
have been planned for evacuation of bulk power in the range
of 3,000-6,000 mw over longer distances. The planned 765kV
transmission systems are expected to be implemented during
XII Plan or early XIII Plan period.
HVDC Transmission System: During XI Plan, Balia-
Bhiwadi 2,500 mw HVDC bipole and upgradation of
Talcher-Kolar bipole by 500 mw has been completed.
Another HVDC bipole as Dedicated Transmission line, i.e.
Mundra- Mohindergarh 2,500 mw is being constructed
under private sector by Adani Group. Three more HVDC
systems have been planned for completion during XII Plan
or early XIII Plan.
1200kV transmission system: The Aurangabad-Wardha
400kV Quad D/C line which is part of the transmission
system for evacuation of power from Mundra UMPP has
been planned and designed in such a way that this line would
be converted into a 1,200kV S/C line at a later date.
Untitled Document
GROWTH OF TRANSMISSION SECTOR |
Transmission Lines (ckm) |
| End of |
400kV |
220kV |
|
Central |
State |
JV/Pvt |
Total |
Central |
State |
JV/Pvt |
Total |
| 6th Plan |
1,831 |
4,198 |
-- |
6,029 |
1,641 |
44,364 |
-- |
46,005 |
| 7th Plan |
13,068 |
6,756 |
-- |
19,824 |
4,560 |
55,071 |
-- |
59,631 |
| 8th Plan |
23,001 |
13,141 |
-- |
36,142 |
6,564 |
73,036 |
-- |
79,600 |
| 9th Plan |
29,345 |
20,033 |
-- |
49,378 |
8,687 |
88,306 |
-- |
96,993 |
| 10th plan |
50,992 |
24,730 |
-- |
75,722 |
9,444 |
105,185 |
-- |
114,629 |
| 11th Plan |
75,974 |
33,681 |
8,443 |
118,098 |
11,004 |
128,823 |
468 |
140,295 |
Substations (MVA) |
| End of |
400kV |
220kV |
|
Central |
State |
JV/Pvt |
Total |
Central |
State |
JV/Pvt |
Total |
| 6th Plan |
715 |
8,615 |
-- |
9,330 |
500 |
36,791 |
-- |
37,291 |
| 7th Plan |
6,760 |
14,820 |
-- |
21,580 |
1,881 |
51,861 |
-- |
53,742 |
| 8th Plan |
17,340 |
23,525 |
-- |
40,865 |
2,566 |
81,611 |
-- |
84,177 |
| 9th Plan |
23,575 |
36,805 |
-- |
60,380 |
2,866 |
113,497 |
-- |
116,363 |
| 10th plan |
40,455 |
52,487 |
-- |
92,942 |
4,276 |
152,221 |
-- |
156,497 |
| 11th Plan |
74,880 |
73,172 |
630 |
148,682 |
5,956 |
213,760 |
1,567 |
221,283 |