The transmission & distribution sector
has time and again proved to be the
weakest link in the country's power
value chain. India's aggregate technical
and commercial losses in the power
sector have touched nearly 30 per cent,
making a woeful comparison with
global standards. In this special story,
Mrinalini Prasad explains the legacy
reasons for high T&D losses and the
steps that are being taken to bring them
down to acceptable levels.
Power remains one of the major issues in India. The reforms
in the sector have been going on for several decades.
However, the focus has largely been on the generation
side. As a result, while the sector has taken massive strides with
increased capacity additions in past years, bridging of demand
and supply gap still remains a concern. Capacity addition
programs have successively increased. However, there is still a
lag in the plugging of transmission and distribution losses. The
large part of energy already being generated is lost in
transmission and distribution process. Further, investment in
the new projects is also jeopardized due to failure of the
government to bring down these losses to an optimum level. At
present, average annual AT&C losses are estimated to be
around 28 per cent.
T&D losses are the biggest challenge in the power sector.
Technical and non-technical losses together have contributed
to high level of T&D losses in the country. Inefficient use of
electricity, power theft, unauthorized connections, political
interference and lack of consumer awareness are the main
causes of T&D losses.
Distribution sector is a vital link in the power sector value
chain as it completes the revenue cycle. Unfortunately, this is
the weakest link in the power sector in India. This not only has
had an effect on the financial health of the distribution utilities,
but has also widened the demand-supply gap further.
Untitled Document
What are T&D losses? |
|
T&D losses are the power losses that are caused in the
process of transmission of electricity from the generation
end to the consumers. A large part of the losses are
technical in nature, however, faulty meters and power thefts
have also resulted in commercial losses. Together, the losses
have been termed as Aggregate Technical and Commercial
(AT&C) losses. AT&C losses provide a realistic picture of the
actual energy loss at the distribution end.
The technical losses depend on the type of conductors used,
transformer capacity, and other equipments used for
transmission and distribution of electricity. These losses are
intrinsic to power transmission system and all the countries
report some percentage of technical losses. The Commercial
losses are caused due to illegal consumption of electricity.
These are caused due to discrepancy in meter reading, faulty
meters, power theft and collection inefficiency. |
T&D losses in India are among the highest in the world.
Inadequate investment in the transmission and distribution
network is one of the main reasons for high T&D losses in the
country. From 19.8 per cent in 1992-93, the losses rose to 33.98
per cent in 2002. In 2009, average AT&C losses in the country
were estimated to be 27.15 per cent. In southern region, the
average AT&C losses were 19.49 per cent whereas northern
region reported losses at an average of 36.44 per cent. AT&C
losses for North-Eastern region are the highest. In 2009-10,
losses reported by the North Eastern region were 36.44 per cent
against the national average of 27.15 per cent.
Though the current average of AT&C losses in the country is
28 per cent, there is a wide variation in the losses reported by
different states. In some states, the losses are as high as 60 per
cent, while some others have been able to bring down these
losses considerably. In terms of capacity, 25 per cent of T&D
losses would account for about 50,000 mw capacity, with the
total energy generation in India reported to be 2,07,006 mw.
T&D losses are the main cause of mounting financial
losses on the state distribution utilities. According to a
Planning Commission report, the reported AT&C loss of
Rs.28,853 crore for 20 major states in the X Plan is an
underestimate. Actual AT&C losses are estimated to
exceed Rs.40,000 crore. Increase in investment in the
generation sector will further increase the financial losses if
the T&D losses are not checked.
REASONS OF HIGH T&D LOSS
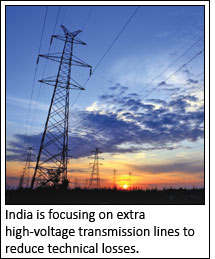
The main reason for the high rate of T&D losses in India is
insufficient investment made in the transmission and
distribution sector. The investments have been
particularly low in sub-transmission and distribution.
While the investment in generation has increased steadily,
transmission has not kept up with it. This led to mismatch
in the generation and supporting transmission system.
Without the strengthening of the existing grids and
development of new systems, the load on the transmission
systems have increased resulting in increased T&D losses.
Power theft is one of the major causes of high T&D losses
in India. Inefficiency in the power distribution system has
led to failure in checking of power theft and this leakage
continues to plague the sector. According to the Economic
Survey of 2006-07, loss due to theft and pilferage is
estimated to be about Rs.20,000 crore annually.
As per the provisions of the Electricity Act, 2003, Special
Courts to deal exclusively with cases of electricity theft have
been set up in 23 states except Bihar, Goa, Jharkhand, Kerala,
Arunachal Pradesh and Mizoram. In addition to this, special
police stations have also been set up in 11 states viz. Andhra
Pradesh, Delhi, Gujarat, Karnataka, Madhya Pradesh,
Maharashtra, Orissa, Rajasthan, West Bengal, Himachal
Pradesh and Tripura. Considering the High AT&C losses in
various states, it is proposed that Special Courts may be set
up in all districts together with police stations.
Further, improper load management and poor quality of
distribution transformers used are also responsible for high
T&D losses in the country. About 75 per cent of the total
technical loss and almost entire commercial loss occurs at
the distribution stage.
APDRP
The Accelerated Power Development & Reforms
Programme (APDRP) was launched in March 2003 as additional central assistance to states for strengthening
and upgrading of sub-transmission and distribution
systems of high-density load centres like towns and
industrial areas with main objectives of reduction in AT&C
and commercial losses; improve quality and reliability of
supply of power. Under this, states were given investment
for financing distribution sector projects and it also
provided incentives for the improvement in performance.
Total 574 projects at the cost of Rs.17,329 crore were
sanctioned under APDRP in the X Plan period.
The government had targeted to bring down the
AT&C losses to 15 per cent by the end of X Plan, from
the 33 per cent in the beginning of the Plan. In the X Plan, nine
states showed cash loss reduction of Rs.5,255 crore against
their loss in 2001-02 under the APDRP. However, the actual
AT&C losses of most of the state power utilities remained
high and this made them financially sick. The losses
continued to be around 27 per cent by the end of the X plan.
The APDRP succeeded to an extent. Under the program,
the metering status in the country improved considerably.
The 11kV feeder metering reached 98 per cent in 2008 from
81 per cent in 2002. Consumer meeting was reported to be
89 per cent. Delhi, Haryana and Kerala achieved 100 per
cent consumer metering. However its under-achievement
in reducing AT&C losses and reinstating financial
viability of the distribution companies, made it necessary
for the government to reintroduce the programme in the
12th Plan period.
R-APDRP
Government continued the APDRP in the XI Plan period as
Restructured APDRP. Certain terms and conditions of the
APDRP scheme were revised and the scheme was launched
in 2008. The focus of the R-APDRP scheme was to establish
base line data, fix accountability, strengthen and upgrade
sub-transmission network and reduce AT&C losses up to 15
per cent. Projects under the scheme were proposed to be
taken up under two parts - Part A and Part B. Projects under
Part A included base line establishment and IT applications
for energy auditing. The projects under Part B included
strengthening of sub-transmission and distribution
projects. The review of R-APDRP is currently under progress
and the final performance report is yet to come out.
FINANCIAL HEALTH OF STATE UTILITIES
The financial health of distribution utilities in the country
is a matter of concern. The financial losses have shown
increase in the last few years. While the utilities should
make serious efforts to reduce the AT&C there should be
adequate tariff to recover the cost of supply. If the present
trend continues, projected losses in the year 2014-15 will be
Rs.1,16,089 crore as per the study conducted by
MERCADOS for the 13th Finance Commission.
Cumulative losses of distribution utilities as on March
31, 2009 are estimated to be about Rs.75,000 crore. From
the PFC Report "Performance of State Power Utilities", data
for the year 2008-09 in respect of 40 utilities of states that have unbundled their SEBs has been analyzed. On subsidyreceived
basis, 11 utilities-APCPDCL, BYPL, NDPL,
NESCO, WESCO, DGVCL, MGVCL, PGVCL, UGVCL,
CSPDCL & WBSEDCL-are in profit and 29 utilities are in
loss. Net worth of only 18 utilities was positive in 2008-09.
This included four discoms of AP, LAEDCL in
Assam, BYPL & NDPL in Delhi, all 4 discoms
in Gujarat, MESCOM in Karnataka,
MSEDCL in Maharashtra, all 3 discoms
of Rajasthan, CSPDCL in
Chhattisgarh and WBSEDCL in
West Bengal. Totally, 22 utilities
have shown negative net worth.
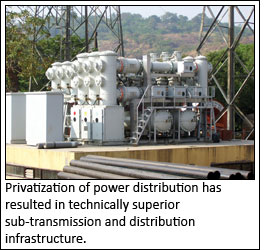
PPP IN POWER
DISTRIBUTION
Privatization and Distribution
Franchisee models have been
attempted in some states. Delhi and
Orissa experimented with
privatization of distribution utilities.
With the initiation of power sector
reforms, Orissa was the first to segregate
electricity distribution business from
generation and transmission and formed
four distribution companies. It did not
work well due to lack of transitory
support, tariff inadequacy, and lack of implementation of
theft-control measures.
On the other hand, privatization of distribution business
in Delhi reflects success as it took adequate care about the
shortcomings of the Orissa model. Bhiwandi in
Maharashtra is an example of successful distribution
franchisee experiment. Torrent Power was selected as the
distribution franchisee for Bhiwandi in January 2007.
Torrent Power has been successful in bringing down the
AT&C losses in the region from 54.64 per cent to 20.20 per
cent. The metering in the region has improved from 23 per
cent to 100 per cent. After Bhiwandi experiment, several
other towns including Nagpur, Aurangabad and Jalgaon
have also been awarded to distribution franchisees. Many
other distribution companies are considering appointing
distribution franchisees.
ROLE OF SMART GRIDS
Smart grids are transmission network that utilize
information and communication technologies to make the
transmission infrastructure more efficient and resilient. It
enables developers and operators to carry out real time
monitoring and controlling the systems. This helps in
reducing AT&C losses, peak load management, outage
management, power quality management and also
channeling power from renewable energy resources.
Management of power systems is becoming more
complex with the increase in renewable power plants in
the country. Besides, rapid urbanization also demands
quality and reliable power supply. Apart from this, need for
reduction of AT&C losses, viability of distribution
companies and sustainability concerns have paved way for
the development of smart grids in the country.
Power ministry received a number of proposals for
development of smart grids in the country. After detailed
evaluation, the ministry selected 14 proposals. These pilot
projects have been estimated at a total cost of Rs.400 crore.
The Central government will fund up to Rs.200
crore under the R-APDRP for the proposed
projects and the rest will be funded by the
respective state governments. The
projects will focus on reducing AT&C
losses and also incorporation of
renewable energy in the system.
The projects are expected to be
completed by 2013-14.
Smart Grids require
implementation of advanced
technologies in monitoring,
measurements, control,
automation, communication, IT for
energy auditing and metering among
other things. Development of
technologies in these fields will help in
development of efficient smart grid
projects.
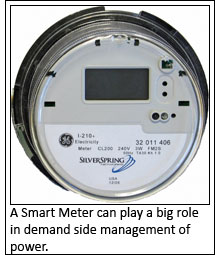
SMART METERS AND
DISTRIBUTION LOSSES
Smart meters are an important part of smart grid
implementation as they are vital in ensuring greater
efficiency, reduction of AT&C losses and also theft
reduction. They have several advantages over the
traditional meters. Smart meters enable real time
communication, information storage and energy loss
calculation. It also consists of anti-tampering mechanism.
Automatic Meter Reading (AMR) is often referred to as
Smart Metering. AMR notes the meter readings
electronically eliminating any chances of errors that are
associated with manual data recording. AMR is beneficial
to utilities as well as consumers. By implementing AMRs,
the utilities save the time and resources that are required to
visit the site and record meters manually. It will also ensure
that the meter reading is accurate and hence the cash flow
to the utility will be improved. Besides, the meter reading and data recording process will be faster. Also, the utilities
will be able to identify any tampering with the meters
immediately. The defects in the meters will also be
identified soon.
T&D LOSSES IN DEVELOPED COUNTRIES
The transmission and distribution losses in the developed
countries are in the range of 4 to 8 per cent. Countries in
Europe and United States of America have T&D losses of
about 6 to 8 per cent. Japan and Germany have reported
losses of 4 per cent. Russia, on the other hand, has reported
losses of around 12 per cent. India compares badly to the
T&D loss average of the developed world. Even China has
been able to check its T&D losses with just 7 per cent loss
reported.
THE WAY AHEAD
Electricity is a concurrent subject and hence it is pertinent
that the Centre and State work together towards bringing
down the AT&C losses in the country. The government at
both levels should take steps to curtail the losses and in
turn mounting financial losses of the distribution
companies. Further, larger investment in the sector is
required to bring down the losses and also improve the
quality of power supply. High losses areas need to be
identified and appropriate steps must be taken to control
losses in the region.
While efforts from the Central and State governments
are required, distribution companies also need to draw a
road map to reduce these losses. A result-oriented time
bound strategy is should be adopted by the utilities.
Further, automatic accounting and energy auditing will be
an important step by distribution companies in checking
their AT&C losses and improving their cash flow.
The 18th Electric Power Survey Committee, headed by
Central Electricity Authority Chairman has mentioned
that T&D losses in the country are proposed to be brought
down to around 17 per cent by the end of XII Plan and
further to about 14 per cent by the end of XIII Plan. Though
the trend in the sector has not been very impressive, it may
be possible to come close to the target if all-out efforts are
made by power utilities and state governments.
Untitled Document
OVERALL T&D LOSSES (%) |
| State |
2007-08 |
2008-09 |
2009-10 |
2010-11 |
2011-12 |
| Andhra Pradesh |
20.3 |
19.2 |
18.1 |
16.1 |
15.3 |
| Arunachal Pradesh |
43.7 |
48.0 |
39.1 |
35.6 |
34.5 |
| Assam |
28.0 |
29.6 |
34.8 |
29.9 |
27.7 |
| Bihar |
39.1 |
38.0 |
38.3 |
37.0 |
35.0 |
| Chhattisgarh |
31.0 |
28.6 |
38.7 |
34.7 |
32.7 |
| Goa |
16.7 |
21.0 |
16.6 |
17.4 |
17.6 |
| Gujarat |
23.8 |
22.8 |
24.5 |
22.7 |
22.3 |
| Haryana |
28.1 |
25.7 |
26.8 |
24.4 |
22.7 |
| Himachal Pradesh |
13.5 |
13.2 |
14.7 |
14.6 |
14.5 |
| Jammu & Kashmir |
61.9 |
61.3 |
63.0 |
60.0 |
58.5 |
| Jharkhand |
42.3 |
43.0 |
38.5 |
33.5 |
40.8 |
| Karnataka |
25.3 |
23.3 |
21.4 |
20.1 |
19.6 |
| Kerala |
19.9 |
19.9 |
19.2 |
19.1 |
18.6 |
| Madhya Pradesh |
40.1 |
39.0 |
35.6 |
34.1 |
32.6 |
| Maharashtra |
29.1 |
26.5 |
25.2 |
22.5 |
21.6 |
| Manipur |
48.4 |
51.1 |
45.8 |
43.3 |
38.0 |
| Meghalaya |
33.4 |
31.2 |
34.0 |
30.0 |
28.4 |
| Mizoram |
24.9 |
32.6 |
37.0 |
35.4 |
34.3 |
| Nagaland |
36.4 |
31.0 |
36.5 |
30.8 |
28.1 |
| Puducherry |
13.8 |
13.7 |
13.5 |
13.5 |
13.5 |
| Punjab |
21.5 |
18.5 |
19.7 |
17.8 |
16.8 |
| Rajasthan |
35.5 |
31.9 |
29.9 |
27.6 |
24.8 |
| Sikkim |
22.3 |
34.0 |
40.6 |
42.4 |
38.8 |
| Tamil Nadu |
18.0 |
18.0 |
18.0 |
18.0 |
17.0 |
| Tripura |
23.4 |
24.1 |
24.7 |
20.9 |
20.1 |
| Uttar Pradesh |
32.6 |
28.6 |
32.3 |
28.9 |
24.4 |
| Uttarakhand |
29.7 |
28.0 |
24.5 |
22.5 |
20.5 |
| West Bengal |
24.3 |
23.3 |
23.8 |
23.5 |
22.3 |
| Source: Planning Commission |