The electrical machinery
industry seems to have fared
much better during 2010-11
compared to capital goods and the
overall manufacturing sector. The
composite production index for the
industry that reflects outcome of solid
investment in power capacity,
increasing generation and expanding
electrification, was up by 18 per cent
during the year, twice the rate for
capital goods and a little above that in
total manufacturing. Another
observation over medium term tells us
that even during downturn hit 2008-
09, when capital goods had increased
at 7.3 per cent and overall
manufacturing only 2.8 per cent,
electrical machinery production index
had increased at a fair rate of 12.6 per
cent. Over the past six years also, the
average increase works out to a decent
20+ per cent.
Among the 34 electrical machinery
items and gadgets only seven recorded
decline in production during 2010-11,
17 recorded double-digit and around
ten, single-digit growth. The
production index of window type air
conditioners shot up 49 per cent, over
61 per cent during 2009-10. Boiler
production was up by 21 per cent, over
23 per cent during 2009-10. In fact,
even during the recession-hit 2008-09,
the boiler production had increased 17
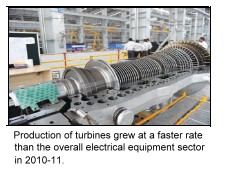
per cent. Turbines (39 per cent) and
electric generators (13 per cent) were
other items which have shown
consistent performance over 2005-06
to 2010-11.
For insulated cables & wires (35 per
cent), air & gas compressors (42 per
cent), electric fans (24 per cent),
power capacitors (27 per cent) and
power & distribution transformers
(13 per cent), the FY11 was the
second/third consecutive year of
robust growth. Process control
equipment output index spurted 63
per cent, but that was after 27 per cent
decline in the earlier year. Dry cells,
GLS lamps and fluorescent tube are
among the items whose production
has been eroding in recent years.
Akin to the broader group of
machinery & machine tools,
composite WPI of electrical
machinery & gadgets remained
subdued during the year.
Untitled Document
Electrical Machinery: Index of Industrial Production |
(% change over previous year) |
| Segment |
2009-10 |
2010-11 |
| Refrigerators & Airconditioning Plants |
-10.5 |
31.2 |
| Cooling Towers |
-20.0 |
0.5 |
| Refrigerators (Domestic) |
26.5 |
10.1 |
| Power Driven Pumps |
65.9 |
3.6 |
| Air & Gas Compressors |
26.7 |
41.7 |
| Electric Generators |
20.9 |
24.3 |
| Electric Motors |
34.0 |
0.6 |
| Electric Fans |
32.9 |
24.3 |
| Power & Distribution Transformers |
16.4 |
13.4 |
| Turbines (Steam/Hydro) |
24.1 |
26.1 |
| Power Capacitors |
22.2 |
27.7 |
| ACSR/AA Conductors |
98.8 |
-27.6 |
| Winding Wires |
5.0 |
5.4 |
| Dry Cells |
-4.8 |
-1.7 |
| GLS Lamps |
3.7 |
-10.2 |
| Fluorescent Tubes |
22.7 |
-0.2 |
| TV Receivers |
27.1 |
1.9 |
| TV Picture Tubes |
35.7 |
-16.9 |
| Electrolytic Capacitors |
2.3 |
10.6 |
| Process Control Instruments |
-27.4 |
62.9 |
| AC Poly-phase House Service Meters |
11.3 |
-1.7 |
| AC Single Phase House Service Meters |
82.9 |
20.4 |
| Gear Boxes |
9.4 |
4.7 |
| Switchgear (Circuit Breakers) |
2.9 |
26.8 |
| Sealed Compressors |
40.7 |
6.0 |
| HT Insulators |
8.4 |
11.8 |
| Storage Batteries |
18.2 |
5.1 |
| Boilers |
23.6 |
21.4 |
| Protection System/Switch Board |
9.4 |
-7.4 |
| Insulated Cables & Wires |
69.2 |
14.2 |
| Lighting, Fitting & Fixtures |
1.8 |
-0.6 |
| Control Panels, Boards, Disks |
2.7 |
13.2 |
| Electric Motors Phase One |
0.6 |
6.5 |
| Window Type Air Conditioner` |
60.7 |
49.4 |
| Total Electrical Machinery |
22.2 |
18.0 |